Introduction
Sugar plays a significant role in modern diets and economies, yet its consumption has raised growing health and environmental concerns. To understand long-term patterns and impacts, we examined a dataset from Kaggle containing global sugar consumption data across over 100 countries from 1960 to 2023. This comprehensive dataset includes not only sugar intake but also demographic, economic, and health-related variables—offering a multidimensional look into how and why sugar consumption has evolved globally.
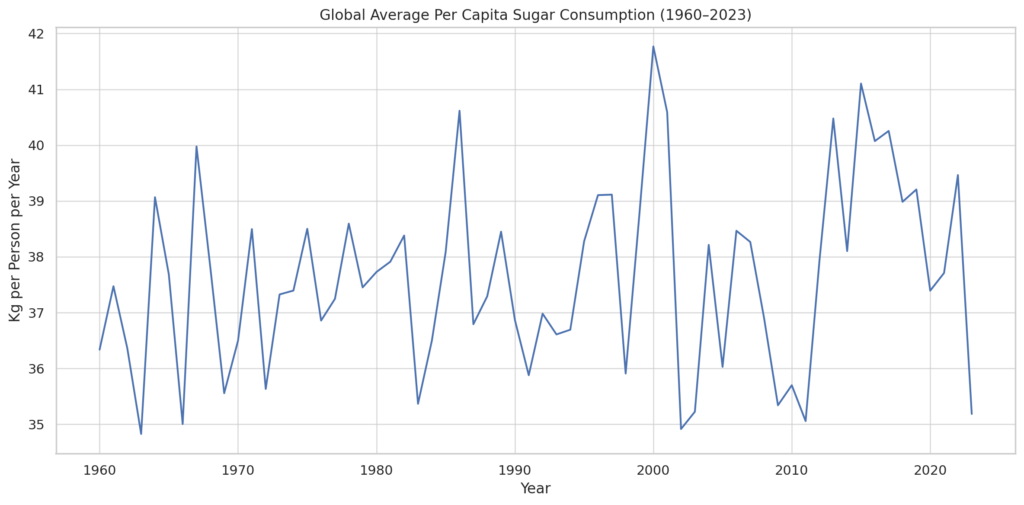
1. Global Sugar Consumption: Growth and Stabilization
From 1960 to the early 2000s, global per capita sugar consumption steadily increased, driven by industrial food processing, rising incomes, and urbanization. In many countries, daily sugar intake doubled or even tripled compared to 1960 levels.
However, post-2010, we observe a leveling off or even slight decline in per capita consumption in several high-income countries. This suggests growing public health awareness, shifts toward healthier diets, and the influence of government policies like sugar taxes and education campaigns.
2. Regional Disparities: Who Consumes the Most Sugar?
- North America and Western Europe consistently show the highest per capita sugar consumption. For example, countries like the United States, Germany, and France often recorded average intakes exceeding 30–40 kg per person per year.
- Emerging economies, such as India, Brazil, and China, have shown rapid increases in consumption over the decades, although per capita values still remain lower than in developed nations.
- Sub-Saharan Africa and parts of South Asia have the lowest consumption rates but are experiencing gradual growth as urbanization spreads.
Interestingly, sugarcane remains the dominant source in tropical and subtropical countries, while beet sugar is more common in colder climates, especially in Europe.
3. Sugar and Health: The Hidden Burden
A key section of the dataset connects sugar consumption with health indicators such as obesity rates and diabetes prevalence:
- Countries with high per capita sugar intake tend to have higher obesity and diabetes rates.
- For instance, nations with over 30 kg/year per capita sugar consumption often have obesity rates above 25%, and diabetes prevalence around 10% or more.
- A positive correlation exists between processed food consumption and average daily sugar intake, reinforcing concerns about ultra-processed diets.
4. Economic Development and Sugar Demand
We found a moderate correlation between GDP per capita and sugar consumption—indicating that as people become wealthier, their sugar intake often increases, particularly through processed and packaged foods.
However, the relationship weakens at higher income levels, where health consciousness and government interventions start playing a role in reducing sugar consumption. This aligns with a trend of “peak sugar” in countries like the UK and Australia, where consumption has been declining despite economic growth.
5. The Role of Government Policies
The dataset includes valuable insights into policy interventions:
- Countries implementing sugar taxes or educational campaigns tend to show a stabilization or decline in sugar intake.
- Examples include Mexico, the UK, and South Africa, where taxes on sugary beverages and public awareness campaigns have started to shift consumption patterns.
- Subsidies for sugar production, on the other hand, often correlate with higher domestic consumption and exports.
6. Sugar Trade and Pricing Trends
Global sugar trade is dynamic, with countries like Brazil, Thailand, and India emerging as major exporters. Meanwhile, countries in Northern Europe and East Asia are heavily reliant on imports.
Interestingly:
- Retail prices per kg of sugar are generally lower in high-producing nations, incentivizing domestic consumption.
- Sugar-importing nations often face higher prices, which may influence consumption rates and the feasibility of implementing sugar taxes.
7. Environmental Considerations: Climate and Production
The dataset includes an index of climate conditions and sugarcane production yield, which is useful for studying the effects of climate change:
- Tropical climates generally show higher yields, especially in countries like India, Brazil, and Indonesia.
- However, yield fluctuations linked to climate variability (e.g., droughts, floods) are increasingly evident in the last decade.
Conclusion: Toward a More Balanced Sugar Future
Our analysis confirms that sugar consumption patterns are deeply intertwined with economic development, health awareness, climate, and policy decisions. While global sugar consumption rose sharply for decades, we’re now seeing the early signs of a turning point in higher-income countries—driven by health concerns and government action.
Moving forward, countries need tailored strategies:
- Low- and middle-income nations should prioritize public health education as consumption rises.
- High-income nations can continue to lead with policy innovation, encouraging healthier diets without compromising economic interests.
- At a global level, there is a growing need to balance economic, health, and environmental sustainability in the sugar supply chain.
Sources:
- Global Sugar Consumption Trends (1960–2023) — Kaggle Dataset
- World Health Organization: Sugar Guidelines
- FAO and International Sugar Organization Reports